
Real-time Business Intelligence Dashboard
During a time of increased remote working, it’s essential that managers and staff are afforded a forensically clear view of a business’ key performance indicators, which may historically have been available in an office or office-generated. A real-time BI dashboard is the way forward.
Integrate a BI dashboard in your document management system
Key indicators comprise business components such as cashflow, orders, procurement activity, stock levels, delivery status; geographical intelligence such as office, depot or distribution activity; quality insights such as fulfilment levels, complaints, satisfaction ratings and loyalty trends; and softer data insights into attributes such as welfare and wellbeing.
During the pandemic and afterwards Document Logistix has saw a significant uptake of our business intelligence tools, notably in the retail, finance, insurance and legal sectors.
Any organisation in any sector will benefit greatly from an early warning solution that provides a dashboard view of critical data, especially in times of commercial uncertainty.
Introducing business intelligence at your fingertips
Document Manager BI is a three-in-one single solution that combines business intelligence with quick and easy reporting, and powerful predictive analytics in self-service dashboards.
Document Manager BI works seamlessly in Document Manager to aggregate any data that is important to running your business. Staff are empowered to be proactive based on real-time business intelligence clearly presented right in front of them.
Business Intelligence Dashboard
Document Manager BI is easy-to-use business intelligence and dashboard reporting software. It is a single reporting tool that can show data from multiple sources in one place.
Initially developed for the UK finance sector, the reporting dashboard is highly secure and GDPR compliant.
The BI dashboard makes it easy for anyone to visualise and interact with their data in real time, anywhere, on any device.
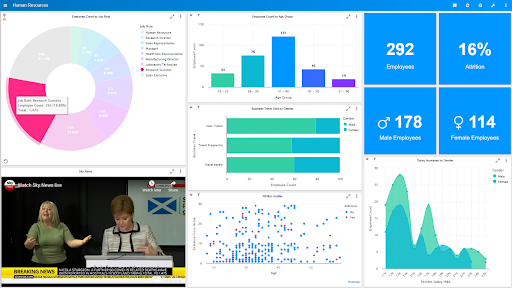
BI dashboard best practices
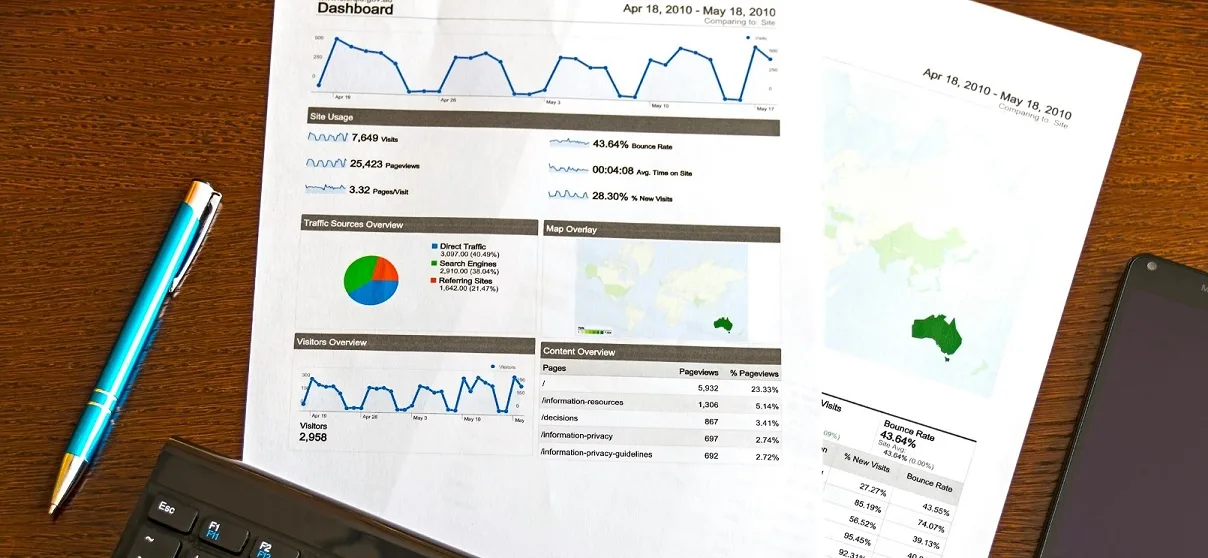
Dashboard Data Connectors
There are a wide range of connectors and pre-configured dashboards that bring multiple data sources together in Document Manager BI.
Business Intelligence Report
Make company-wide reporting as easy as it should be.
BI Report is a new Document Manager BI module that allows you to create and schedule in-depth visual reports.
The reporting module allows users to schedule charts to other users via email, and applies the relevant, current security restrictions and user permissions as it distributes reports.

Top ten reasons to use a BI dashboard
A BI dashboard is a powerful tool for organisations to visualise data and make informed decisions. Here are the top 10 reasons to use a BI dashboard:
- Data visualisation
BI dashboards provide clear data visualisations like charts, graphs and heat maps, making complex data easier to understand and act on.
- Real-time analytics
Dashboards can display real-time data, enabling businesses to monitor KPIs instantly.
- Enhanced decision-making
By presenting data in an actionable format, BI dashboards help users make data-driven decisions with confidence, reducing reliance on intuition or outdated information.
- Centralised data access
A BI dashboard aggregates data from multiple sources (databases, APIs, CRMs, spreadsheets) to for a centralised view that ensures everyone is working from the same data set.
- Customisable to business needs
Users can customise dashboards to show the most relevant KPIs for different departments (sales, marketing, operations), ensuring that stakeholders see data that matters to them.
- Improved collaboration and communication
Dashboards provide a unified view of performance metrics, fostering collaboration across teams.
- Historical data tracking
BI dashboards allow users to track historical trends, compare data over time and identify patterns that are important for forecasting and strategic planning.
- Increased operational efficiency
By automating data collection and reporting, a BI dashboard saves time and resources, freeing teams from manual data analysis and allowing them to focus on core business activities.
- Better monitoring of business performance
Dashboards can track key business metrics like sales growth, customer retention or employee productivity in real-time, enabling businesses to monitor performance against goals and benchmarks.
- User-friendly interface
BI dashboards are designed with a user-friendly interface, making them accessible to non-technical users, which empowers employees at all levels.
BI dashboards provide clarity, efficiency and actionable insights, making them essential tools for modern business intelligence.
What is a Business Intelligence Dashboard?